Addressing SLA Violation by Agents: Onyx Data DataDNA May 2024 Challenge 3rd Runner-Up


About this project
Foreword
For this challenge, I chose to analyze SLA violations within the Technical Support team. My report specifically investigates the performance of 8 agents and identifies areas where they could improve their adherence to Service Level Agreements (SLA).
Step 1: Organizing the Data
 Grouping the Variables (Image by Author)
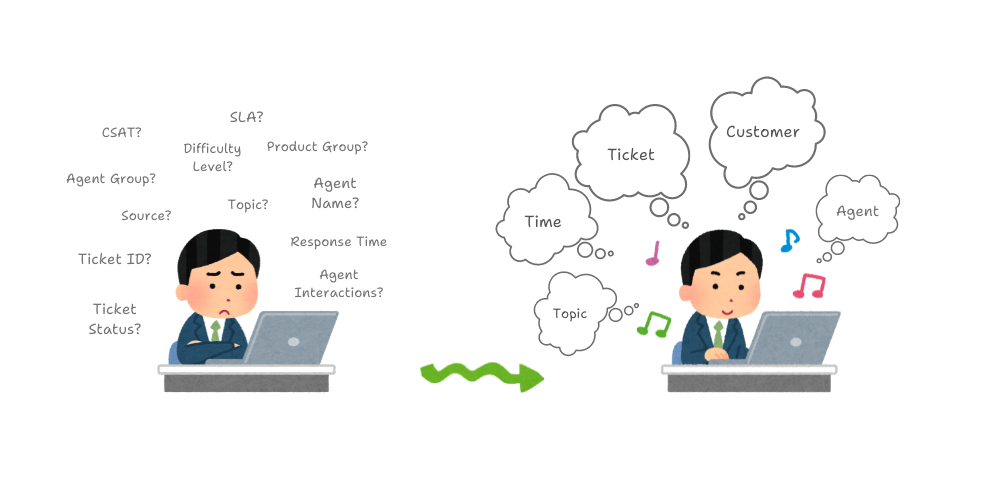
The vast amount of data within the dataset can be overwhelming at first glance. To simplify the analysis of the dataset (containing 22 columns), I grouped related variables into five categories:
- Agent: name, group, interactions, CSAT, source
- Customer: country of origin, latitude & longitude
- Ticket: ID, status, urgency, difficulty level
- Time: created time, first response time, expected and actual SLAs (for both first response and resolution), close time
- Topic: subject matter, product group
Step 2: Identifying the Main Topic
After grouping the variables in the dataset, I identified a topic that piqued my interest: agent performance. I wanted to create a report specifically for agents to help them understand their performance in terms of response time and ticket resolution. This includes identifying tickets that violate service level agreements (SLAs) and the associated overdue times. By tracking overdue tickets, agents can pinpoint areas for improvement and work towards better performance.
In the first step, I identified the key variables needed for my analysis. Since my goal was to assess agent performance related to SLA violations and overdue tickets, I focused on data related to agents, tickets, timestamps, and ticket topics. My report aims to answer the following questions about agent performance and SLA compliance:
- What defines an SLA violation for a ticket?
- How many overdue tickets (SLA violations) does each agent have for both initial response and resolution?
- How does the overdue time vary based on the communication channel (chat, email, phone)?
- For each agent, which topics are associated with the most SLA violations?
- When do requests peak, and do violation times correlate with these peak periods?
Step 3: Creating the Report Layout
With the main topic and content identified, I designed a three-section report layout in Canva. Leveraging the Onion Model, I structured each section based on data granularity, ensuring information progresses from high-level overviews to increasingly detailed insights.
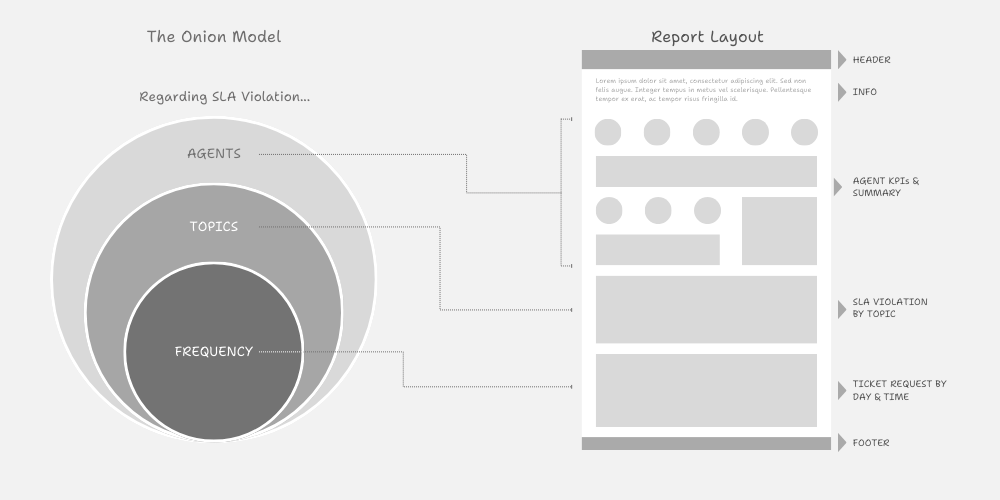 The Onion Model and Content Layout Flow (Image by Author)
Step 4: Analyzing the Dataset
To assess SLA compliance for each agent, I focused on identifying deadlines. I needed to determine the expected response and resolution times based on the communication channel (chat, email, phone) for both Initial Response (IR) and Ticket Resolution (TR). Once these deadlines were established, I could then calculate the number of overdue tickets for each agent. My analysis utilized Power BI and here’s the calculation for:
- Initial Response (IR) Deadline: The time limit for an agent’s first response to a ticket.
SLA to First Response Deadline (in minutes) =
    ROUND(
        ( 'Technical Support Dataset'[Expected SLA to first response] - 'Technical Support Dataset'[Created Time] ) * 24 * 60
    , 0)
- Ticket Resolution (TR) Deadline: The time limit for an agent to fully resolve a ticket.
SLA to Resolve Deadline (in days) =
    DATEDIFF(
        'Technical Support Dataset'[Created Time],
        'Technical Support Dataset'[Expected SLA to resolve],
        DAY
    )
To determine overdue tickets, I needed to calculate the time each agent took for both initial response and ticket resolution. Here are the formulas used:
- Initial Response (IR) Time: The time it takes an agent to first contact a customer after receiving a request for help.
Initial Response Time (in minutes) =
    ROUND(
        ( 'Technical Support Dataset'[First Response Time] - 'Technical Support Dataset'[Created Time] ) * 24 * 60
    , 0)
- Ticket Resolution (TR) Time: The time it takes an agent to resolve a ticket.
Ticket Resolution Time (in days) =
    ROUND(
        DATEDIFF(
            'Technical Support Dataset'[Created Time],
            'Technical Support Dataset'[Resolution time],
            DAY
        ),
        0
    )
Following the calculation of agent response and resolution times, overdue time was determined by subtracting these values from the deadline. To avoid skewing the average overdue time, a value of 0 was assigned for tickets where agents met the SLA.
- Initial Response (IR) overdue: the extra time taken by agent to give initial respond
IR Overdue =
IF(
    'Technical Support Dataset'[Initial Response Time (in minutes)] > 'Technical Support Dataset'[SLA to First Response Deadline (in minutes)],
    'Technical Support Dataset'[Initial Response Time (in minutes)] - 'Technical Support Dataset'[SLA to First Response Deadline (in minutes)],
    0
)
- Ticket Resolution (TR) overdue: the extra time taken by agent to resolve a ticket
TR Overdue =
IF(
    'Technical Support Dataset'[Ticket Resolution Time (in days)] > 'Technical Support Dataset'[SLA to Resolve Deadline (in days)],
    'Technical Support Dataset'[Ticket Resolution Time (in days)] - 'Technical Support Dataset'[SLA to Resolve Deadline (in days)],
    0
)
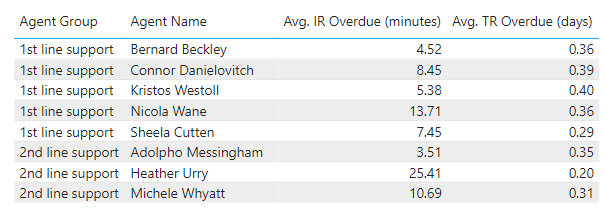 Average IR and TR Overdue by Agents (Image by Author)
- Rounded Hours: For the x-axis in the matrix presented in the third section, we will use rounded hour values.
Rounded Hour Time =
TIME(HOUR('Technical Support Dataset'[Created time]), 0, 0)
- Days of the Week: The y-axis of the matrix in the third section will represent the day of the week.
CT - DayOfWeek =
FORMAT('Technical Support Dataset'[Created time], "ddd")
Step 5: Creating the Final Report
After using Power BI to gather insights, I created the final report using a combination of Canva and Excel. Canva was used for the overall design and layout, while Excel was used to create specific data visualizations.
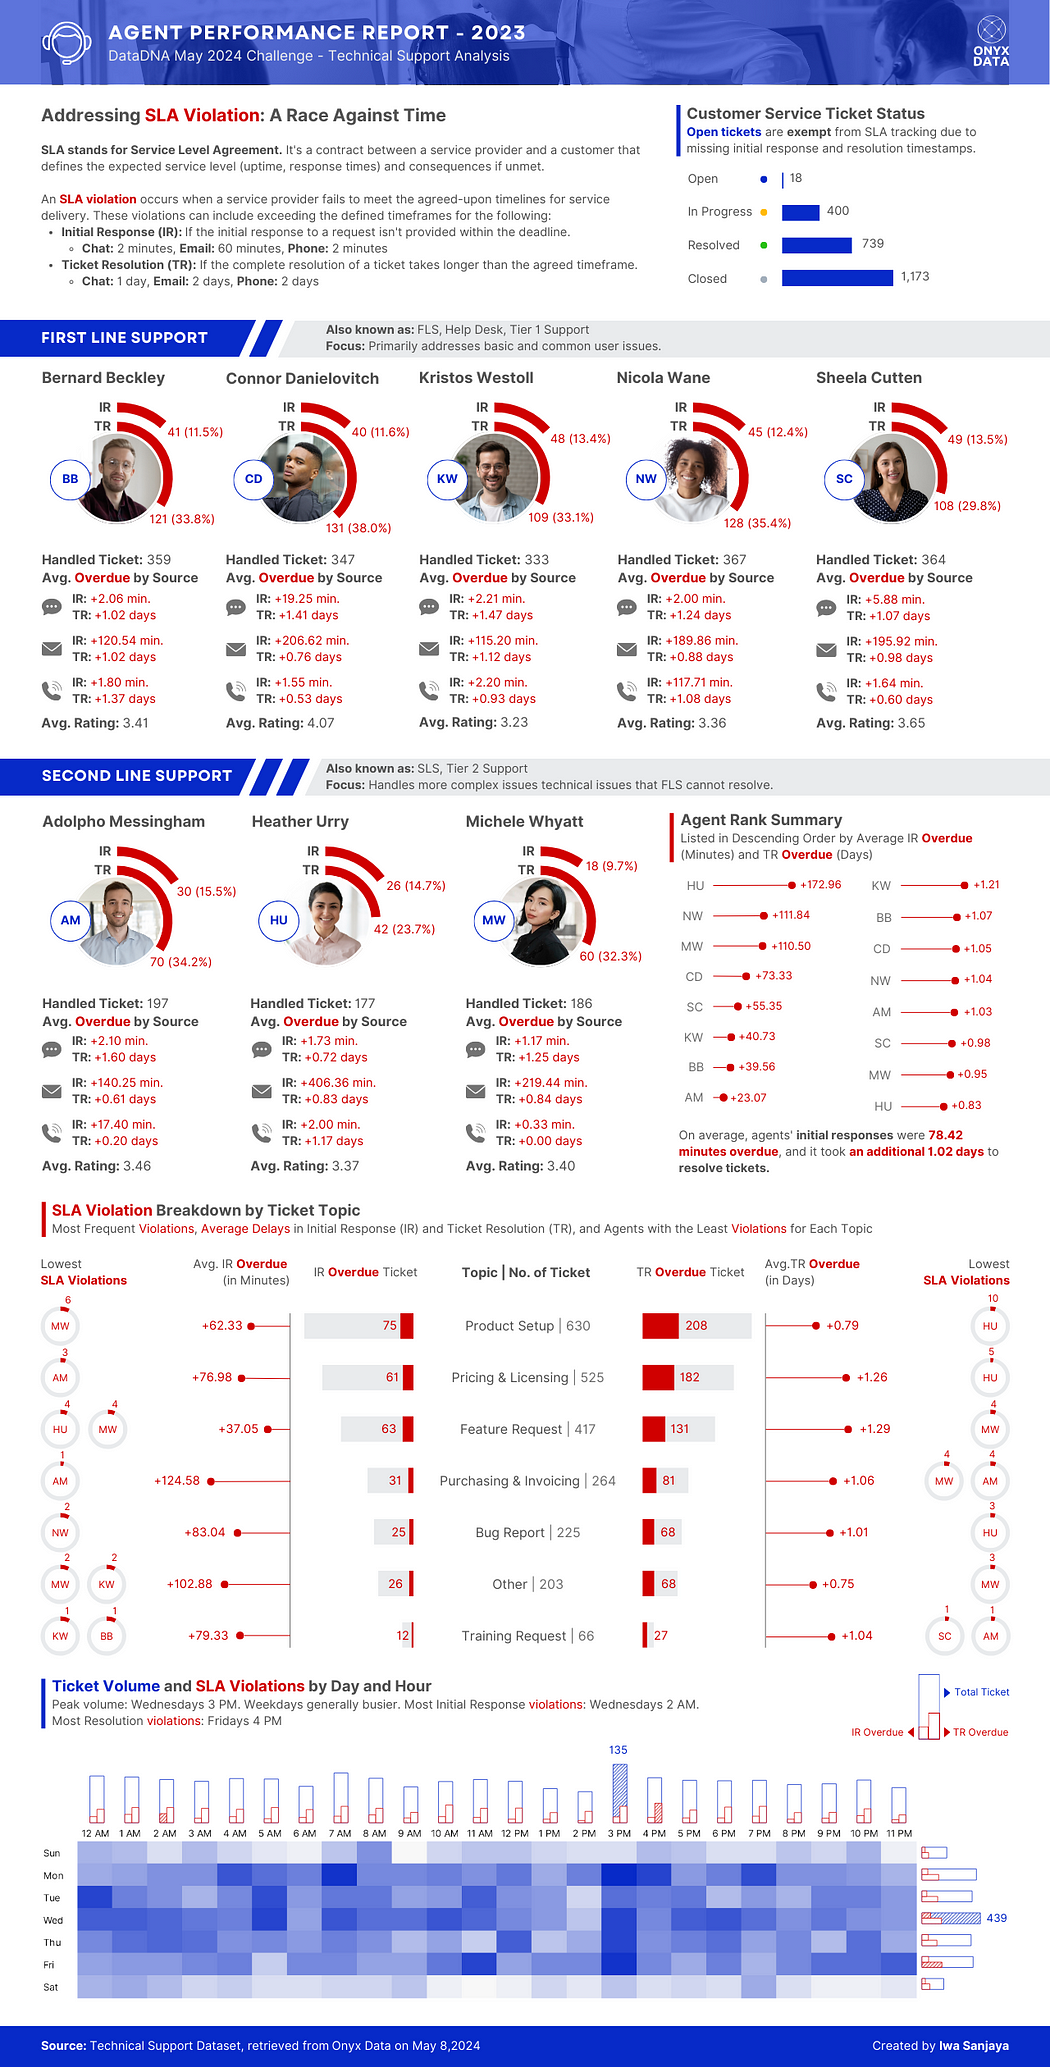 Agent Performance Report 2024 (Image by Author)
Info Section: Definition of SLA Violations
- This section defines SLA violations, which occur when agents exceed response or resolution timeframes specific to communication channels (chat, email, phone). It also presents the number of tickets by status.
Section 1: Agent Performance
- KPIs for eight agents are displayed, categorized into two groups: First Line Support (FLS) and Second Line Support (SLS). An agent rank summary on the right showcases their initial response and ticket resolution overdues.
Section 2: SLA Violations by Topic
- This section dives into SLA violations by topic, alongside average initial response and ticket resolution overdues. It highlights agents with the least violations for each topic. Notably, Michelle Whyatt has the least initial response violations across three topics. Heather Urry and Michelle Whyatt also achieve the least ticket resolution violations on three topics each.
Section 3: Ticket Volume and SLA Violations by Day/Hour
- This final section analyzes overall ticket volume and SLA violations by day and hour. The trend reveals higher ticket volume on weekdays, peaking on Wednesday at 3 PM. Weekends experience lower volume. The highest concentration of initial response violations occurs on Wednesday at 2:00 AM, while ticket resolution violations peak on Friday at 4 PM.
When creating visualizations, I rely on coolors.co for color inspiration. Their platform offers a variety of search options, allowing me to discover different color schemes and select the ideal combination that complements my reports and dashboards.
Thank you for reading!
I hope this case study provided valuable insights. If you have any questions, feel free to reach out.
For those interested in exploring more data storytelling and data visualization content, I consistently create such content on my Patreon page.


